How to start to solve & approach this problem with ZERO knowledge?
Question is: find largest rectangular area? These techniques will enrich your algorithmic arsenal.
Let’s start by drawing rectangles, may be, we will make some observations.
- Start drawing rectangles for simpler cases (all descending or all ascending). Red points are the left and right borders.
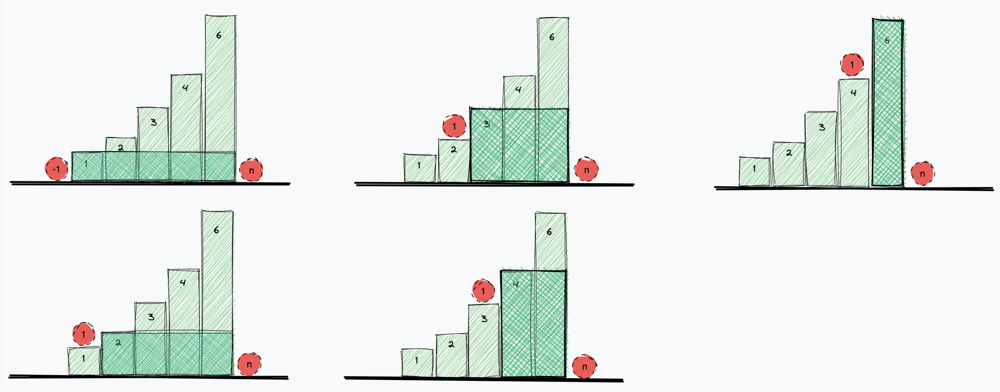
Made observations:
- Smallest element always dominates the rectangular area
- Smaller element exists in greater element (it’s included implicitly) => [keeping the smaller element to the end of calculation might be good approach??]
- Max contribution / performance of single bar is limited by it’s nearest smaller neighbours (left and right smallers - red balls)
- Let’s draw rectangles on mixed histogram, too see different edge cases.
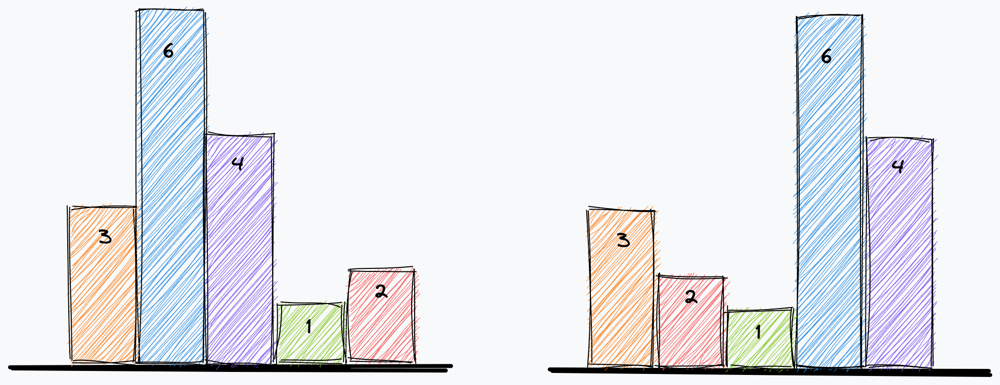
Made observations:
- Here we should play game of “keep the smaller to the end”, because it’s possible rectangle in future.
- When we find smaller than current bar, we should calculate current bar’s rectangular contribution. but it doesn’t mean we will ignore it’s contribution in future for smaller elements. it’s contributing part implicitly resides on smaller bars. Therefore we can only take index into consideration.
Key observations & Implications & Core Idea:
- Core idea: smallest element dominates the “game”
- If you take that smallest element into consideration, best result by taking it into consideration is interval_range * height_of_smallest element
- You have two options: take smallest or don’t
- This idea brings divide & conquer approach
- We can partition histogram on smallest elements (because they are dominating the result)
- Each rectangular bar is fully included in at least one rectangular area [at least itself]
- We need to find that border from left and right for each bar
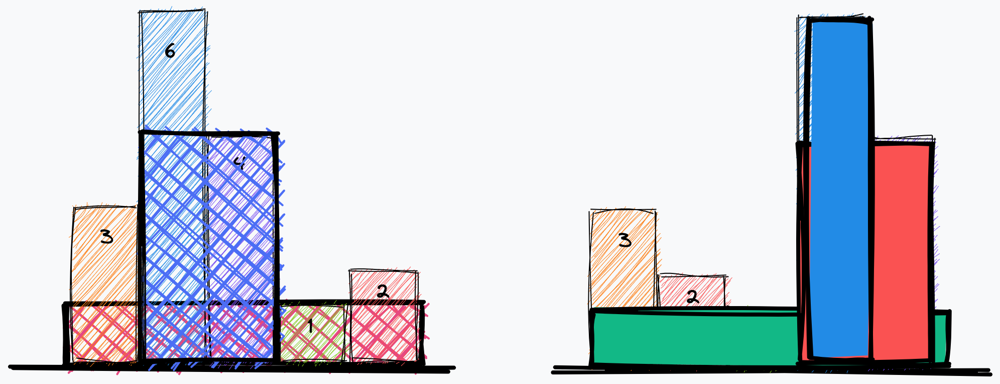
Let’s look at all the possible cases:
- If smaller element comes before or after greater element, that means greater element’s “max contribution” lies within those smaller element’s borders (think about that).
- If there is not any smaller element before greatest element, that means, histogram is non ascending, here we can clearly make this conjecture: if the histogram is decreasing, no need to count greater element’s contribution alongside all X axis. Why?
- Because, it’s contribution exists in element which is smaller than.
- This is the core intuition behind linear solution. Because we are pruning redundant checks by n time.
- If greater element comes after smaller, throughout the histogram, that means it’s non decreasing histogram. Here is the case reversal of previous case. We will approach in the same manner, but starting from the right end of X axis.
Preparing solution:
- We need to track smaller and greater elements by preserving their original position
- To preserve order / positions, stack is the best data structure
- We need to take edge cases into consideration (all increasing, all decreasing)
- As a sentinel value we will use -1 and n. -1 for leftmost border, n for the rightmost border.
- For each bar we should find left smaller and right smaller elements
Implementation [v1]:
def solve(self, heights):
    stack = [-1]
    ans = 0
    i = 0
    n = len(heights)
    leftsmaller = [-1] * n
    rightsmaller = [n] * n

    while i < n:
        while stack and stack[-1] != -1 and heights[stack[-1]] > heights[i]:
            rightsmaller[stack[-1]] = i
            stack.pop()

        if i > 0 and heights[i] == heights[i-1]:
            leftsmaller[i] = leftsmaller[i-1]
        else:
            leftsmaller[i] = stack[-1]
        stack.append(i)
        i += 1

    for i in range(n):
        ans = max(ans, (rightsmaller[i]-leftsmaller[i]-1)*heights[i])

    return ans
Actually, we can manage left and right boundaries in single loop.
Implementation [v2]:
def solveoptimal(self, heights):
    n = len(heights)
    ans, i = 0, 0
    stack = [-1] # left side of stack

    while i < n:
        while stack[-1] != -1 and heights[stack[-1]] > heights[i]:
            # x1, x2, x3 -> ascending order
            candidate = stack[-1]
            stack.pop()
            # if i < top of stack, that means i is right smaller border
            # leftsmaller ... top ... rightsmaller
            # if there is not any smaller element as it increases alongside axis
            # for the smallest element borders will be like : [-1 ... smallest ... n]
            ans = max(ans, (i - stack[-1] - 1) * heights[candidate])
        stack.append(i)
        i += 1

    while stack[-1] != -1:
        candidate = stack[-1]
        stack.pop()
        ans = max(ans, (n - stack[-1] - 1) * heights[candidate])

    return ans
Further Research
- Can you approach & implement this problem by divide & conquering? (think about that, hint: segment tree)
